
One of my patients named Gerry has a very interesting story to tell. He makes a good case for reversing calcium score.
Due to a family history, Gerry had been watching his health markers for 35 years. Gerry is also very good at developing information and demonstrating it. He found out that the commonly accepted indicators that track his LDL cholesterol and blood glucose levels were insufficient. He got duped by not looking at enough numbers or looking at the incorrect numbers.
Regardless, he had a major success in turning that calcium score around. I’ve gone over his story, but he tells it best!
The video is here:
Gerry’s Introduction
Thanks for giving me the opportunity to tell my story! For better or worse, I have an engineering and business background and tend to be a critical observer, so I collected a detailed history of my health markers… and I’ve got a spreadsheet to prove it!
My Attention Getter!
I can tell you from personal experience that the established screening system–the so-called standard of care–may be useful for lawyers, but for medical purposes, it’s useless! Also, it’s probably 15-20 years behind in the adoption of available technology. The system lulls you into thinking that you’re protected if you have good cholesterol and glucose levels. It’s just not true!
People are checked, told they’re ok, and they have an event anyway. The problem is then expertly corrected. We are really good at applying technology after an event. You’re then dutifully followed and with the help of medications, you’re told you have even better markers… and the cycle repeats itself.
I think that a lot of people feel they may be predisposed to cardiovascular (CV) disease, but they haven’t been proactive about it. Maybe they’re not interested in navigating those murky waters. It’s a complex and pretty inexact science. Maybe they’re just not interested?
That’s what this discussion is all about: It provides a little more background to help people decide if they want to reach beyond the “standard of care” to learn if they actually have a problem. And if they do, what they can do about it… other than swallowing statins and blood pressure meds!
Ultimately, it’s about lifestyle! The diagnostic tools are there to guide you. Supplements and medications are there to fill in some gaps, but I agree that “you can’t medicate yourself out of a poor lifestyle.”
My Rationale
I was always concerned about my heart health since there is a CV history on my mother’s side. There were some early events and also deaths.
Since age 35, I tracked both cholesterol and glucose markers carefully and all my numbers were in line. I am now 76.
For a long time, total cholesterol was below 200 mg/dL, and LDL held steady at about 60 mg/dL. Cholesterol levels were supposed to indicate heart health.
Fasting glucose hovered around 95 mg/dL. This was a decent fasting glucose level, I was told, meaning I didn’t have diabetes.
My blood pressure was a little high but was easily controlled with Losartan.
My lifestyle was pretty healthy–my wife likes to cook–and I exercised regularly. In hindsight, however, I had absolutely no appreciation for the role of carbs in my diet.
After a stent procedure at age 71, it took me a year to realize that all these markers meant nothing! My diligent tracking system had failed me! Standards of care, as reflected by the medical establishment, were a hoax!
I now feel strongly about exposing the myths surrounding CV disease and urge everyone to dig deeper and look past those commonly accepted markers. This disease builds silently over decades. Just a little knowledge and motivation can make so much difference over time. A tiny change in lifestyle, if started early, can pay huge dividends in the future.
The Surprise Event – Stent Placement
At age 71, during a long run on a treadmill, I noticed a touch of angina. It felt different than being “winded,” as often happened during a high intensity work out. I saw a cardiologist, and a treadmill stress test led to a diagnosis of 90% occlusion in my LAD (left anterior descending) artery.
It was a classical sequence of events: from a stress test to a cath lab to a stent placement on November 5, 2015, followed by a year of blood thinners and a lifelong regimen of statins. Thankfully, the procedure was uneventful and the angina stopped. So in my case, the stent did some good.
In several follow up visits, I asked what else I could do because I had learned not to trust the lipid markers.
It took me a while to digest the answer: “Keep doing what you’re doing. If you feel symptoms, we’re right here to fix things.” I was told that “Your markers look great.” In fact, my cholesterol levels looked better than before the stent placement due to the statin therapy.
This seemed like encouraging news, but the more I thought about it, the more I came to the realization that this was an unacceptable answer! The “standard of care” was used to double down on the initial failure of using cholesterol markers to predict CV events.
Switching Gears: The Great Awakening!
I began to realize that the cardiologists were betting on the wrong horse…. twice! That was my wake-up call.
I had to find out what was really going on. The traditional markers were obviously useless in predicting CV disease.
I also woke up to the close connection between prediabetes and CV health.
So at age 72, I got very serious about studying what was happening. I decided I would no longer be satisfied with blood pressure readings, simple cholesterol checks, and fasting glucose levels.
I was starting a whole new chapter of tracking my health – a clean sheet.
I discovered a whole new world of CV disease prevention. It was a wealth of proven technology… but rarely used by doctors!
Better yet, almost all these tests and techniques are covered by Medicare. I just had to find a doctor who was willing to prescribe the tests and take the time to analyze the results in an eight-minute office visit!
At any rate, I decided that the days of “come see us when something breaks” were over for me.
The 4 Modules of Medical Tracking
After 6 months of research, I came up with 4 modules to simplify and get my head around tracking my exposure to CV disease. Process type thinking, discrete components, and modules with feedback and control systems worked for me in simplifying this stuff.
Here is a quick spin through the 4 modules:
- Lipids: There are tests that go way beyond cholesterol levels.
- Inflammation markers: There are a broader set of markers, not just C-reactive protein.
- Glucose levels: Use dynamic tests, not just static fasting blood glucose or A1c levels.
- Imaging: This is crucial. You have to know what’s going on in the arterial walls. That’s often more important than understanding blood flow and blood composition.
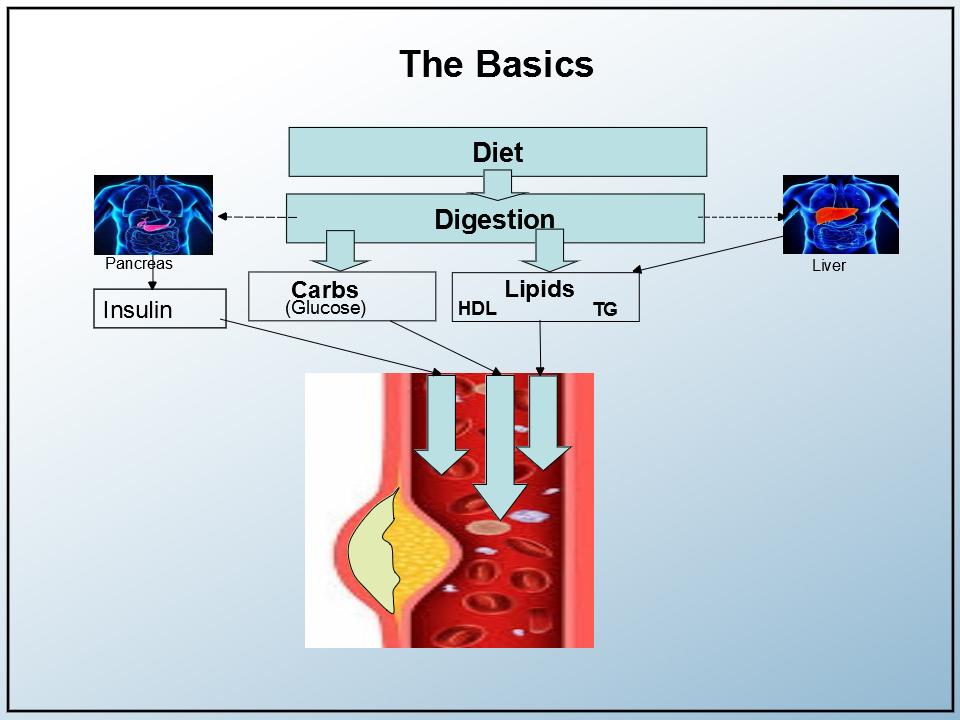
To understand these modules in context, I also developed this simple graphic of my arterial system, including relevant organs. The focus is on the arterial wall, the source of all the damage.
Of course, other elements (like blood pressure, hormone balance, blood profiles, BMI, liver and kidney function, etc.) also needed to be tracked. Lifestyle is the biggest driver of all, but that’s a given and outside the scope of this post.
Moreover, I needed an “integrator” while I tracked these 4 modules. That integrator was Dr. Ford Brewer. Dr. Brewer not only looked at the inter-relationship of these 4 modules but also provides context using other markers and relates experiences with his other patients.
Module 1: Lipids
The first module is the advanced lipid panel. It is very available, very inexpensive, and gives you vastly more information than just looking at your lipid levels.
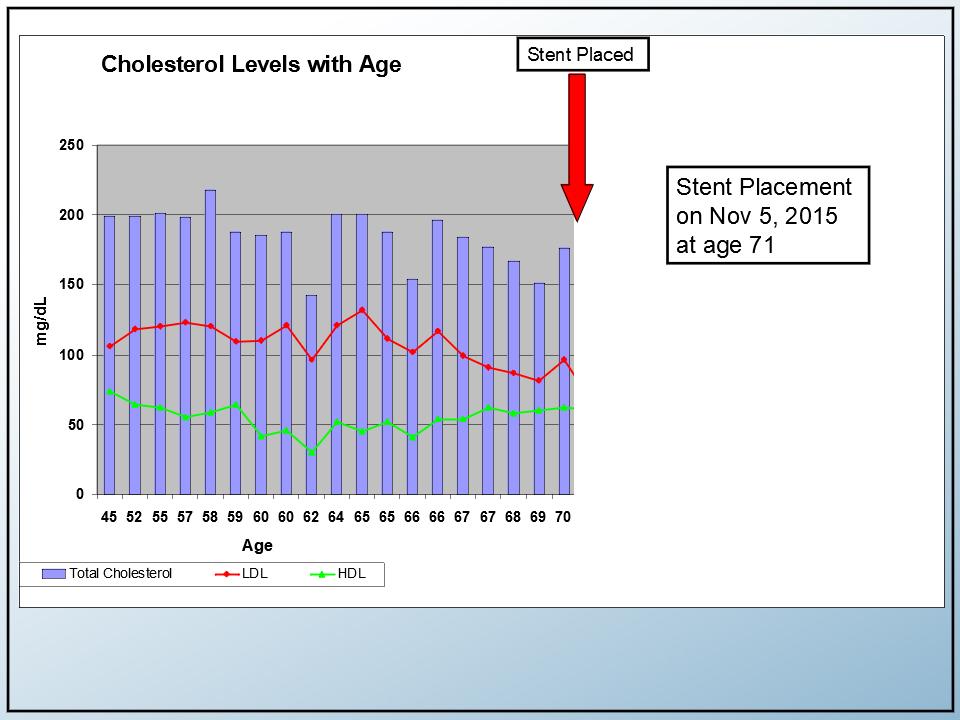
Pre-stent Lipid levels
This is the historical view of my lipids before I encountered angina and the stent placement. It’s actually pretty respectable. That’s the scary part. The total cholesterol levels (the blue bars) were about 200 mg/dL. The LDL levels–the bad ones–were just over 100 (red line), and the HDL levels were about 50 (green line).
Post stent: Low-carb diet, statins, and niacin
Here are my lipid levels after my stent placement. The timeline seems to imply that the stent improved my lipid levels, but we know that’s not really the case.
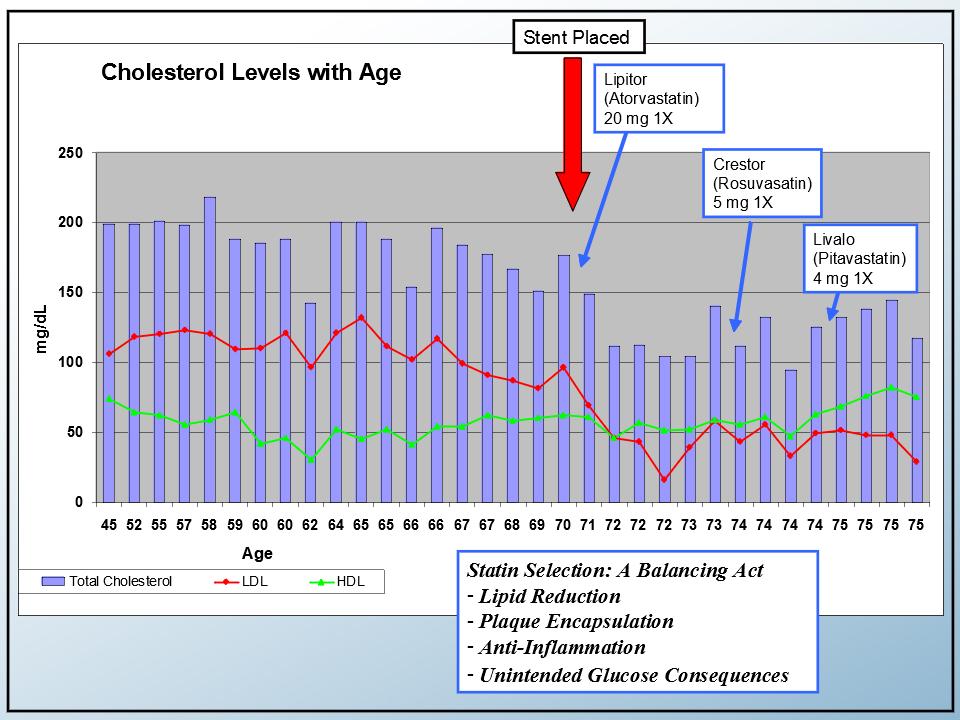
Initially, I started taking the ever-popular Lipitor (Atorvastatin) and blood thinners as part of the standard post-stent regimen. Statins are very predictable cholesterol-lowering drugs. The cholesterol levels can easily be regulated. Every time the statin dose is doubled, the resulting drop in LDL tends to be 6%. Statins also have a reputation for increasing HDL. They work.
After about a year, I started a low-carb diet and added 2 grams of niacin to my daily supplements.
Dr. Brewer noted that the initial drop in my LDL was probably due to the statin. Of course, the primary purpose of statin is to lower the lipid profile. He also noted that, as he often sees in his patients, the statin didn’t have much of an impact on my HDL levels.
I learned that statins also have plaque encapsulation and anti-inflammatory properties in various degrees. On the negative side, there are some unintended glucose consequences.
Also, I’m taking the anti-inflammatory supplement CoQ10 to counteract the statin’s inhibition of CoQ10 production.
Triglycerides and the Triglyceride/HDL ratio
Dr. Brewer emphasizes the triglyceride/HDL ratio as an important CV marker. So I’ve added triglycerides (yellow line) to this slide to complete the lipid picture.
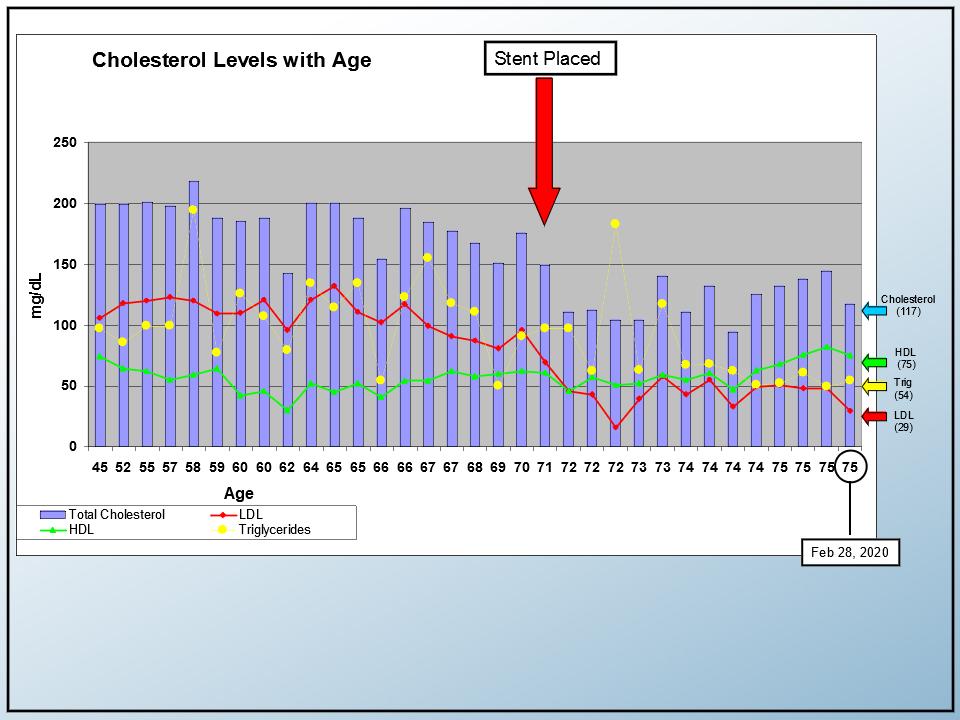
Triglycerides are shown here on the same scale (mg/dl) as LDL, HDL, and total cholesterol. My triglyceride level at the time of the last blood draw was 54 mg/dL.
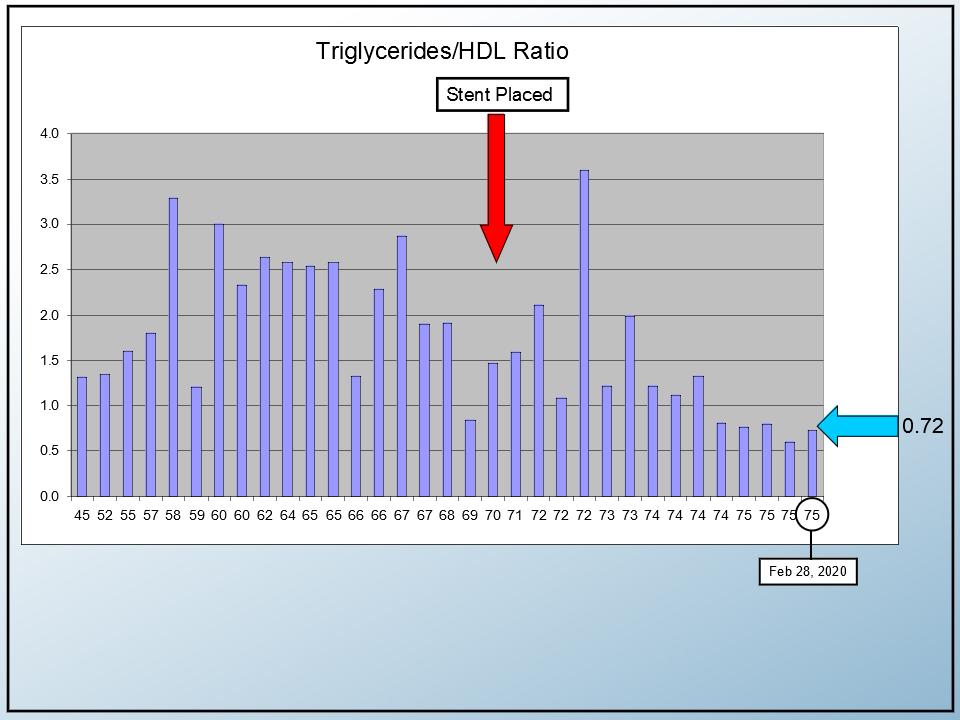
This slide shows the ratio of triglycerides to HDL. It was less than one with the desirable range being less than two. Note, however, that the progression shows some variability, so patience and consistency are in order.
So far, everything looked encouraging. Other markers, like ApoB and Lp(a), were also in range. The advanced lipid profile was good (“B pattern”), but not perfect.
Module 2: Inflammation
The second module deals with inflammation. There are a number of markers available.
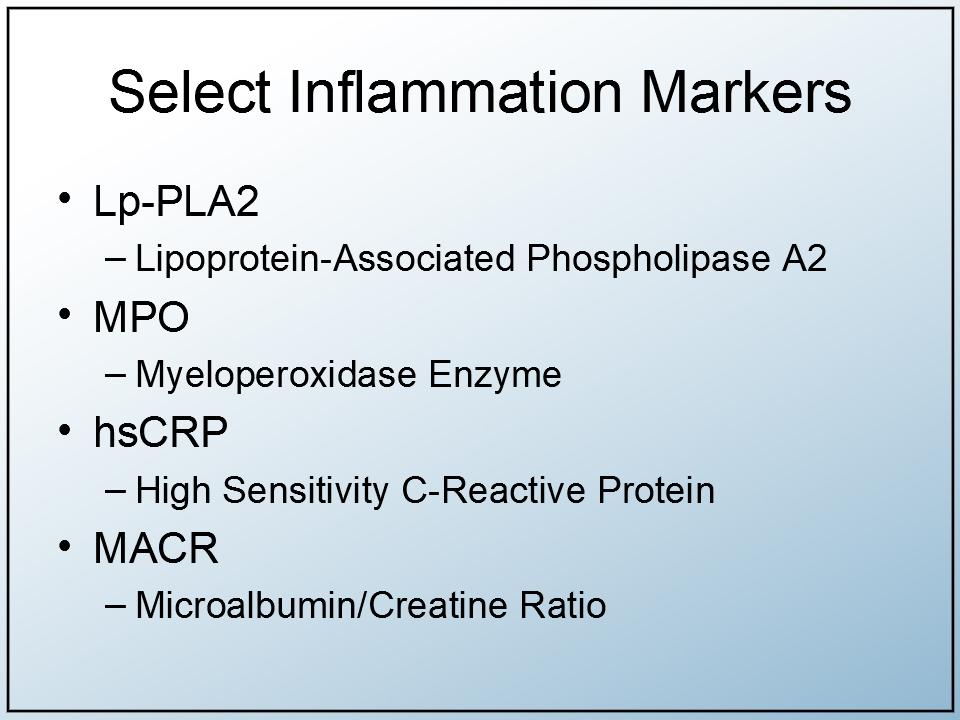
Occasionally, the cardio docs would do a CRP (C-reactive protein) test. I found that the results rarely got much attention unless the CRP markers were way out of range due to some other reaction to an unrelated illness. In the enhanced inflammation panels, there are 3 additional inflammation markers, and the CRP sensitivity is greater (HS-CRP).
In my case, it looked like all inflammation markers were within range. Dr. Brewer agreed and commented that while greater than 50% of his patients above 65 are overweight, less than 10% showed any sign of inflammation. He felt that my profile was not uncommon.
Module 3: Glucose
The third module deals with glucose levels.
My fasting blood glucose numbers hovered around 95 mg/dL and were consistent for 35 years. For those 35 years, I was told, “You’re fine, but let’s keep an eye on it,” since levels in the 80’s were more desirable.
I was told by the medical orthodoxy that HbA1c (hemoglobin A1c) would also be a good indicator of glucose health. With my fasting glucose numbers just below 100 and my A1c holding below 5.6%, I thought things were pretty good. I even remember an endocrinologist saying, “Some of my prediabetic patients would kill for your numbers.”
But somehow, I was suspicious of those levels, and I felt the results were less than optimal for my purposes. In hindsight, my suspicion was correct. The importance attached to fasting glucose and A1C was the third big failure of the “standard of care.”
Oral Glucose Tolerance Test (OGTT)
Rather than just looking at the static blood glucose content, a much better test is a dynamic Oral Glucose Tolerance Test (OGTT), which monitors glucose dissipation over several hours.
So I pursued getting an OGTT done. These tests are readily available, but inconvenient for the patient. The request was also greeted with skepticism by the providers since that test is normally associated with pregnant women and high fasting glucose numbers.
What is an OGTT?
Simply, it’s a way to track your ability to digest carbs. Your fasting glucose is checked as a baseline. You then drink 75 grams of a vile mixture of pure sugar. The lab then takes blood samples after 1, 2, and sometimes 3 hours to track the glucose levels in your bloodstream.
Here are my OGTT results from 4 different tests conducted from May 2019 to February 2020.
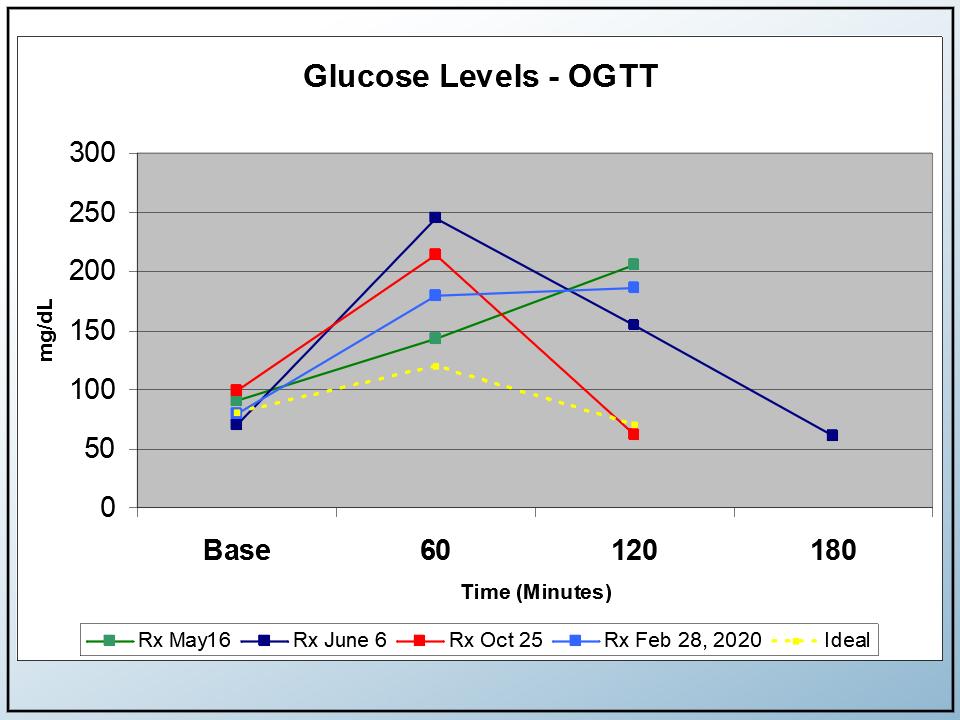
The yellow line represents desirable glucose levels as a response to drinking the sugar water. The light blue was my most recent response (not good in my case). The other OGTT tests moved around a bit but showed consistently poor results.
- My fasting glucose numbers started at just below 100 mg/dL.
- My recent 1-hour glucose level (after taking the sugary drink), was 180. Last year, they were at 207 and 250, so there seems to be an improvement. Still, there is a lot of variabilities and the desirable numbers are in the 130-140 range.
- The 1-hour glucose level should drop back down quickly. But in most cases, that did not happen.
Most of the time, the lab takes 2 samples at 1-hour intervals after taking the sugary drink. But in the test I took in June 2019 (the dark blue line), the lab took an extra sample at the 3-hour mark. It turned out that, after 3 hours, my glucose numbers tend to come down. This seems good intuitively, but the numbers didn’t come down nearly as quickly as they should. See the yellow reference line.
If you looked at my OGTT results, they vary, but all are consistently high (bad!). According to Dr. Brewer, these poor levels are not uncommon with “normal” fasting glucose and A1c levels.
Insulin response
The insulin secretion during the test is also instructive. Again, the yellow line is the desirable level, and the optimal insulin numbers should be in the 50-60 range at the one hour mark as a response to the glucose challenge.
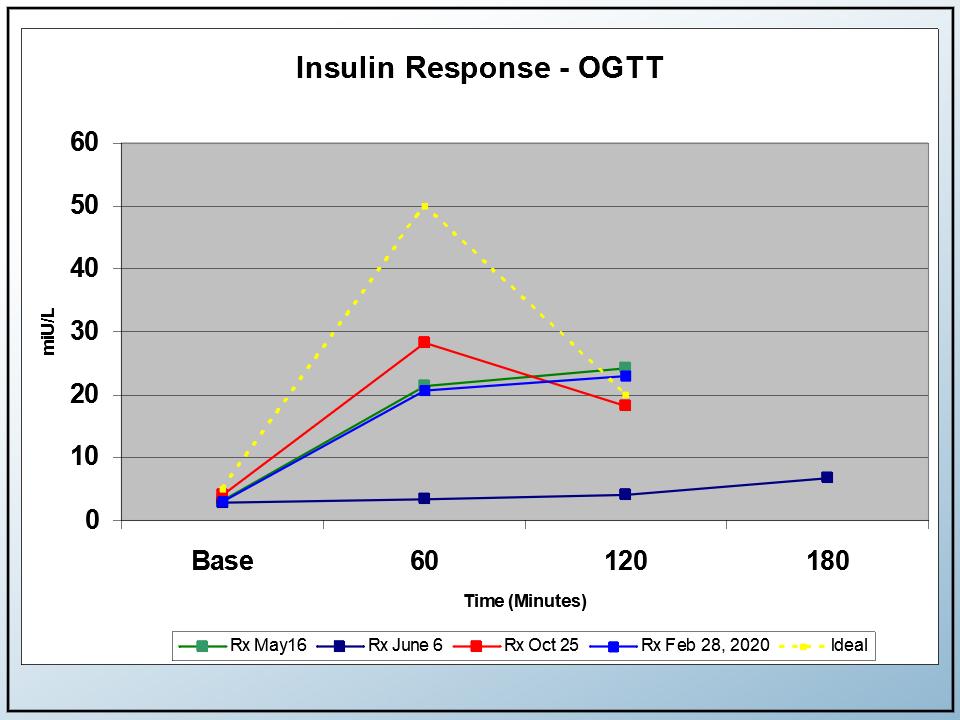
In my case, my insulin numbers did not rise nearly as fast as they should. It looked like the insulin-producing beta cells in my pancreas were lazy. It became clear that I had impaired insulin production.
So it seemed I had a good lipid profile and inflammation numbers. I also had acceptable fasting glucose and A1c levels. Still, I have a terrible oral glucose tolerance profile, so it’s critical that I continue to watch my carbs.
Module 4: Imaging the Artery Wall
This fourth module deals with the walls of the arteries. Ultimately, what I’m trying to avoid is another event. When you think about it, these so-called “events” are not really caused by carbs or lipids, but by inflammation and what goes on in the arterial walls and dislodged particles!
How can we see what’s happening in the artery walls without an invasive, high-risk catheterization procedure?
There are 3 ways:
- Calcium score (also known as coronary artery calcium or CAC test). It measures the amount of calcium deposits in the heart and arteries. It’s safe and non-invasive but only looks at hard or calcified plaque. The results are standardized using the “Agatston” scoring system.
- CIMT. It stands for the “carotid intima-media thickness” test. It measures the plaque build-up between the 2 interior walls of the carotid artery. It’s assumed to represent the plaque build-up in the rest of a person’s CV system. This procedure is similar to a carotid ultrasound test, but the results are very different. The big advantage of a CIMT test over the calcium score is that it picks up both soft and hard plaque.
- CT Angiogram. This is an interesting, emerging technology. Slices of the heart are captured and are put back together with the help of computer modeling.
My Calcium Score
Right now, I’m relying on CAC scores for tracking purposes. I also had an annual carotid ultrasound, but that only measures flow velocity and not plaque thickness and composition. Carotid ultrasounds are heavily marketed but aren’t very useful for tracking plaque build-up.
My CAC history is not as complete as I’d like, but there was absolutely no encouragement from the medical establishment at the time. There still isn’t!
Let’s discuss the calcium scores and use the lipid profiles as context.
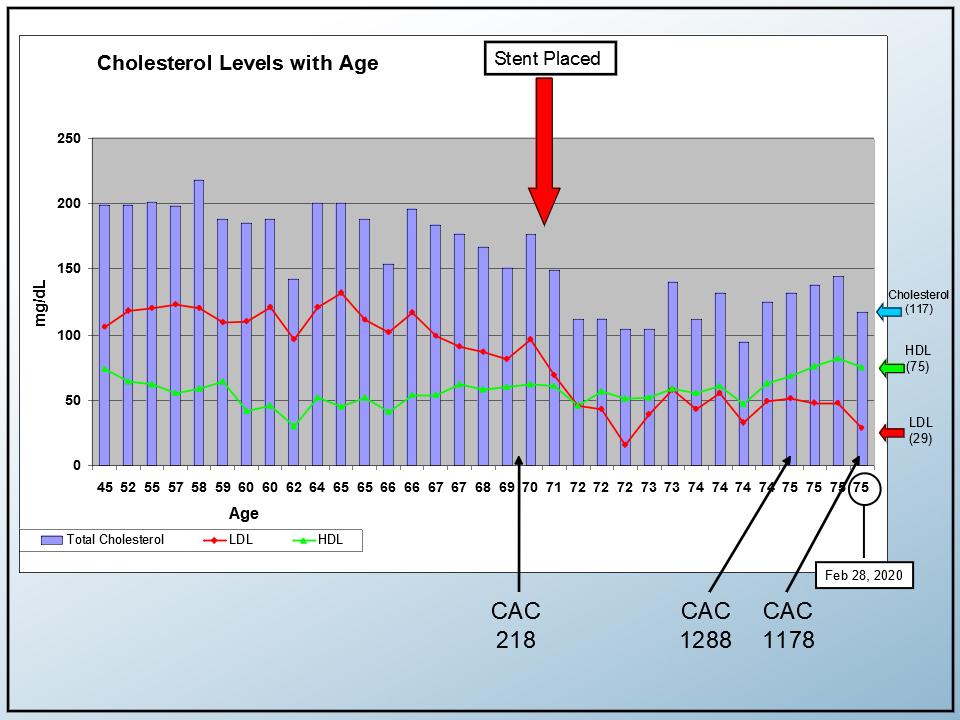
As I reviewed my history, I remembered that I had a CAC test done about a year before the stent placement. I was just curious about it at the time (at age 70 in 2014) and the doctor dismissed it as a novelty. The result showed some plaque (Agatston score of 218): not terrible, but not alarming for a 70-year-old guy.
After the stent was placed, I realized I could use that CAC score as a baseline of sorts, so I had another one done in 2019 at age 74. It showed a score of 1288!
Looking at this timeline and the context of what was going on with my lipids, I wondered what caused the precipitous increase because all my markers were going in the right direction.
The CAC scores were definitely heading south! Most people don’t exceed a 10-20% increase in calcium score each year. My increase in calcium score was significantly higher than that. I was concerned.
In looking for theories, Dr. Brewer offered this explanation:
… I think this is the opposite picture of what most people would expect. You get a calcium score of 218 at age sixty-nine and a half… None of us expect the stent to help. But you added statins, you went low-carb and added niacin a couple of years later. Instead of your calcium score going down, it went up, and it went up fast.
Calcium scores measure calcium. It doesn’t measure soft plaque. I’ve had this talk to very successful patients multiple times when they experienced this phenomenon… They do some great work in terms of improving their situation, and instead of getting their expected decrease in calcium score, they get a big increase…
As you improve the stability of your plaque, the plaque shrinks just a little bit, but most of all, they begin to develop a fibrous material. They go from a soupy, unstable consistency to a hybrid, stable consistency that has calcium in it. My perspective is that you had the same thing happen to you that happened to so many successful patients.
There’s a logical twist or irony with the calcium score. You put down more calcium as you begin to heal. It is a long-term reflection of risk, but short-term, it can be the opposite. That’s one of the major problems with a calcium score.
A year later, I had another CAC test. This time, the score was actually lower. It went from 1,288 to 1,178. Dr. Brewer feels that the downward trend is numerically significant since calcium scores don’t have much variability (which is an advantage over CIMT tests, which can vary with labs and even technicians).
For me, this is encouraging. At worst, it looks like my plaque is stabilizing.
CT angiogram: A motivator
I also had a CT angiogram done. It’s an impressive technology.
This is an actual image of my heart. I threatened my wife that I would put it on the refrigerator to motivate myself not to eat anything with carbs in it. You can see the stent and you can look at the level of calcification for the various arteries.
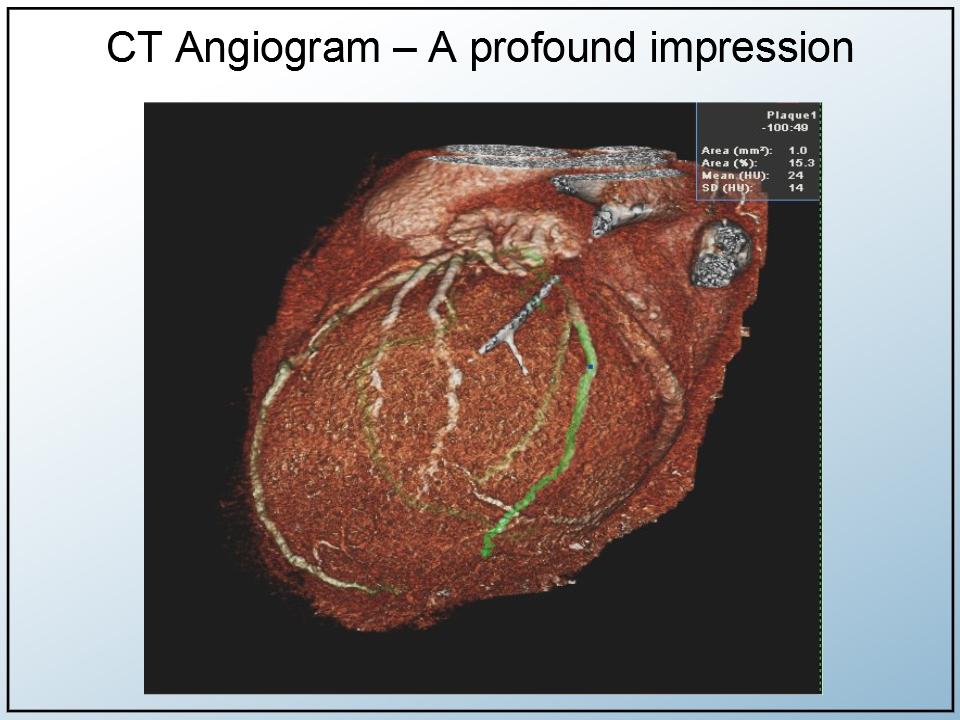
One of the best things about a CT angiogram is that it is approved by Medicare. In my case, there was no cost for this wonderful technology. So I wonder why cardiologists don’t use it more often.
I plan to have a CT scan done annually. There is a little downside to radiation exposure, but I think the benefits and the visual benefits of these tests outweigh the risks.
Dr. Brewer feels that a CT angiogram and calcium score are far better than just taking a typical stress test. The patient gets a good picture of what’s going on with his/her arteries and can help with lifestyle changes, perhaps the most difficult medicine! He cites the SCOTT-HEART trial and the COURAGE trial.
Both trials point to this conclusion: The patient gets a good picture of what’s going on with his or her arteries in their heart. Once you do that, it motivates you to manage that lifestyle. You cannot medicate, you cannot supplement, you can’t stent and you can’t bypass your way out of a lifestyle.
Genetics
We talked about the 4 modules, but there is really a fifth module, as yet unmentioned: Genetics. I have no genetic data yet, but I’ve identified these 10 genetic markers that relate to CV disease.
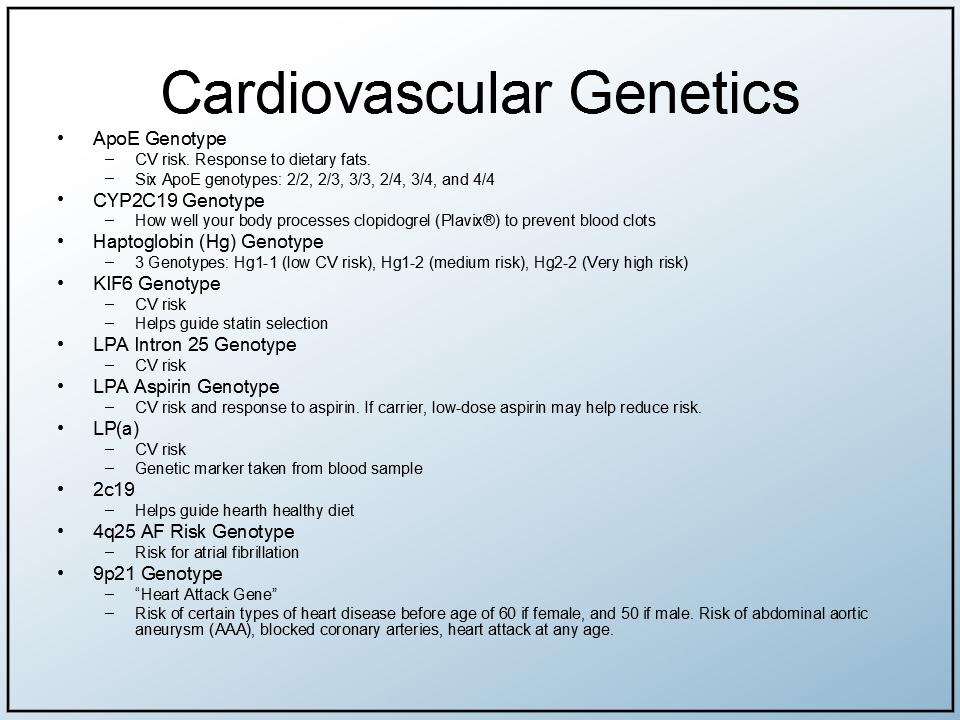
Dr. Brewer agrees that genetics are important but not as critical as some believe. He commented that “genetics loads the gun, but lifestyle pulls the trigger.”
Recap
- The stent placement was a wake-up call. I re-educated myself and changed my lifestyle. I continue to watch my diet and try to keep my carb intake down.
- Regarding statin therapy, I feel I’ve migrated to a good agent addresses encapsulation and lowers inflammation risk while minimizing glucose concerns.
- I think about tracking my CV disease in terms of the 4 modules discussed here: lipids, inflammation, glucose markers, and imaging tests.
- Reliance on simple cholesterol tracking failed me – twice.
- The reliance on fasting glucose and A1c, per the standard of care, was the third failure. I now supplement my glucose metabolism with OGTT testing and insulin assays.
- The fourth failure: a continuing unwillingness to check what is really happening inside my arterial walls before an event occurs. There’s over-reliance on dangerous caths, ineffective carotid ultrasounds, and stress tests. I now plan to continue imaging with CIMT, CT angiogram, and CAC testing.
- I realize now I have to be proactive in seeking these advanced tests. They are all covered by Medicare, except the CIMT tests.
- Genetic testing is part of my plan. I understand that some genome testing may also qualify under Medicare with certain pre-existing conditions.
The Ideal (but Realistic) Treatment Model
In perspective, here is a dream medical ecosystem I wish everyone with CV concerns would create for themselves.
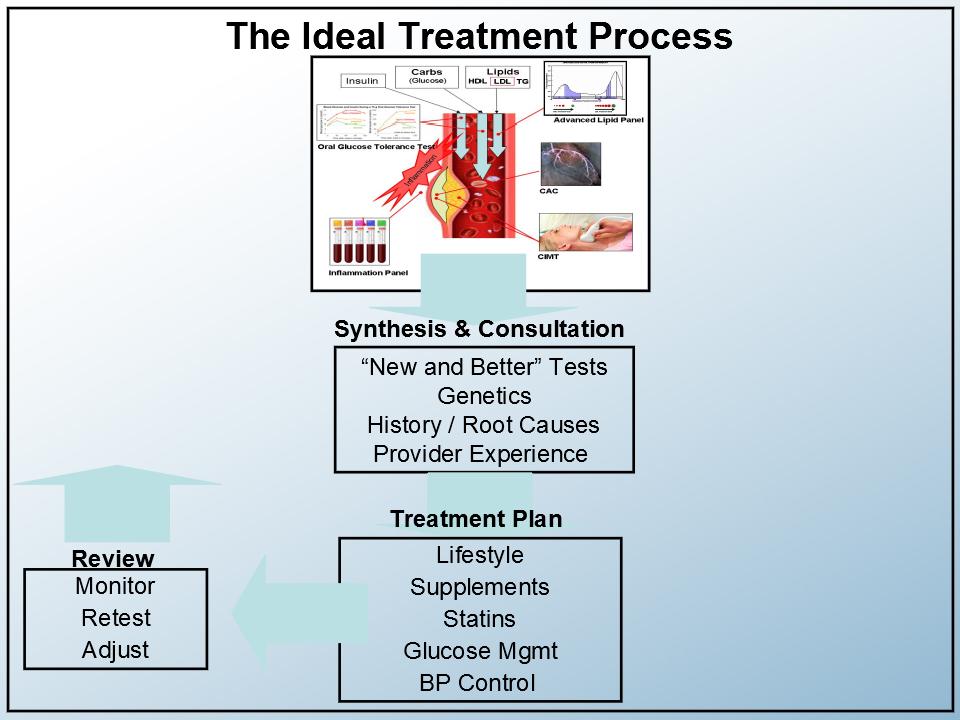
It’s a synthesis of everything we’ve talked about. Note that all of these components are available now!….and covered by Medicare!
A glucose tolerance test and plaque measurements will tell you if you actually have a problem.
We would then want the rest of the “new and better tests” applied and evaluated by an experienced provider.
He would look at historical root causes and add some genetics to the extent they are available.
A treatment plan would focus on lifestyle, supplements, statins, glucose, and blood pressure control.
Of course, any good system deserves feedback, so we would make adjustments and do periodic adjustments to the individualized program. Pretty straightforward, really!
To paraphrase ET: It’s not the fasting glucose and cholesterol, stupid! It’s the arterial wall, the glucose dynamics, and inflammation.
…and finally: “Required” reading
In my journey, I came across three books I highly recommend. Please don’t think of this as a boring set of references. They are all very readable and to me, eye-openers.
“Blood Sugar 101 – What they don’t tell you about Diabetes” by Jenny Ruhl. This book is 230 pages of no-nonsense views about this (largely undiagnosed) disease. Jenny relies on her website and fellow readers, many with “science, software, or engineering backgrounds” to dispel myths, try out diets and drug regimes, and report results to each other.
“The Diabetes Epidemic and You – Should Everyone be Tested? Absolutely Not – Only those concerned about their future” by Dr. Joseph Kraft. In this 110 page classic, Dr. Kraft discusses the importance of understanding the dynamics of OGTT, rather than relying on static and misleading FG and A1c tests.
“Beat the Heart Attack Gene” by Brad Bale and Amy Doneen. This is the 320 page Bible for individual cardio heart health. This book is a compendium for patients who want to take responsibility for their cardio health. Bale-Doneen’s business focus is on professionals. They offer a “preceptorship” course for physicians which teaches a comprehensive strategy for stroke and heart attack treatment and prevention.
Dr. Brewer’s Closing Remarks
Very interesting story, Gerry. Thank you so much for sharing. I think other people have a lot to learn in terms of what you have to share with them. The most important: why we’ve got so many hundreds of millions of people who are unfortunately dying young or becoming permanently disabled. They are young—in their 50s, 60s, 70s.
This shouldn’t be happening. There are answers and ways to prevent this. We’ve talked a couple of times about why so few people are doing it. One of them is COST—a lot of people get caught up in terms of the cost of seeing somebody like me and going through those details you’ve brought up.
You’ve been a great person for educating us. Since you are 75, you’ve been in Medicare for quite a few years. According to you, all of the items that we’re talking about are paid by Medicare, except genetics. The genetics are not critical. They say genetics load the gun, but lifestyle pulls the trigger.
As a patient, what you have to do is to educate yourself. The patient has to request the tests because it’s not something that’s commonly prescribed: an angiogram, a CT angiogram, or a calcium score.
The current typical medical practice doesn’t follow recommended standards. But they can be improved, and they will be improved. But it will take years more of debate.
We have a book coming out about the evaluation of plaque. Its title is “PREVENTION MYTHS: Why a Stress Test Cannot Predict your Heart Attack — and the Tests that Can.”
Here’s the book’s summary in a few sentences:
- The 2 current techniques that are commonly practiced are the Framingham Risk Estimate and the stress test.
- The Framingham Risk Estimate is using the questionnaire of the same name. This is the best we’ve got, but it’s wrong. It is outdated and overestimates risk. It is not unusual to see the actual risk doubled in estimation, especially for women. This overestimated results in a lot of unnecessary statin prescriptions.
- These days, almost all stress tests are of the nuclear stress test type. These studies require a 70% blockage of flow to show a problem, but most heart attacks occur in people with less than 50% blockage of flow! And this only leads to false-negative results. (Tim Russert’s death was due to a false negative stress test.)
- 30% of positive stress tests are false positives, and false positive stress tests unnecessarily lead patients to the catheter lab. These procedures are expensive and uncomfortable. Not to mention the safety of such procedures are debatable.
- Any plaque detected during cardiac catheterization is the reason stents are placed. While 90% of stents are placed to prevent a heart attack, multiple studies (like the ORBITA trial) have shown that stents don’t actually prevent heart attacks.
- There are better ways to measure plaque. Instead of the Framingham estimate followed by a stress test, cath angiogram, and stent, I’d suggest the calcium score, CIMT, and CT angiogram—tests which Gerry highlighted in his story.
- The calcium score is currently the most common among my 3 suggestions. Getting a calcium score is already a major step forward from the current process of Framingham estimate-stress-catheterization-stent.
- Gerry’s case, however, demonstrated the problem of relying on calcium score alone. His case also demonstrated there are advantages in including CIMT for detecting soft plaque, and for year-by-year analysis and monitoring.
- Gerry’s case also demonstrated the clear advantage of CT angiogram in showing the extent of plaque. CT angiogram is also great at motivating the patient to maintain that critical lifestyle.
—
If you found this article helpful and want to start taking steps toward reversing your chronic disease, Dr. Brewer and the PrevMed staff are ready to serve you no matter where you’re located.
To find out more, schedule a consult here: prevmedhealth.com