
Judi was 68. Her doctor wanted to put her on statins because of her age and an LDL cholesterol value of 168. Her doctor also calculated her Framingham Risk Score, and she got 6.4%. That means she had a 6.4% probability of getting a heart attack, stroke, or any cardiovascular (CV) event within 10 years if not treated.
However, Judy had seen too many negative comments about statins online, so she did not want to take them. She watched videos on our YouTube channel. Her calcium score is “0.” In the end, she chose to work on lifestyle changes (including losing weight) instead of taking a statin.
The National Lipid Association agreed with Judi. The association even featured her story on its website, promoting coronary calcium and the MESA scores. And accounting for her zero calcium score, Judi’s CV risk score dropped from 6.4% to 2.6%.
What is the Framingham Risk Score?
The desire to measure plaque and CV risk usually starts with a risk estimator. One of those risk factor estimating tools is the Framingham Risk Score.
The Framingham Risk Score is based on a predictive equation that was developed from the Framingham Heart Study.
From Medscape:
The Framingham Risk Score (FRS) was developed in 1998 to assess the 10-year risk of coronary heart disease (CHD) for individuals with different combinations of risk factors. The data used was from the Framingham Heart Study, an ongoing study begun in 1948 of healthy adults, in a largely white population in Framingham, MA.
In some situations, the Framingham Risk Score is interchangeably referred to with Framingham Risk Calculator, Framingham Risk App, or CV Risk Calculator. However, these other terms usually refer to actual tools or apps used by doctors to encode their patient’s risk factors to come up with a risk score.
Still, whatever you call it, note that Framingham Risk Score is only a guess, not a measurement. And informed specialists nowadays agree that it’s not even a good guess.
Are There Other CV Risk Calculators?
Since 1998, many modifications and adaptations of the Framingham Risk Score Calculator have been released.
There’s the FRS-ATP-III, a 2002 adaptation of the Third Report of the National Cholesterol Education Program (NCEP) Expert Panel on Detection, Evaluation, and Treatment of High Blood Cholesterol in Adults(Adult Treatment Panel III) final report (NCEP Adult Treatment Panel III, 2002).
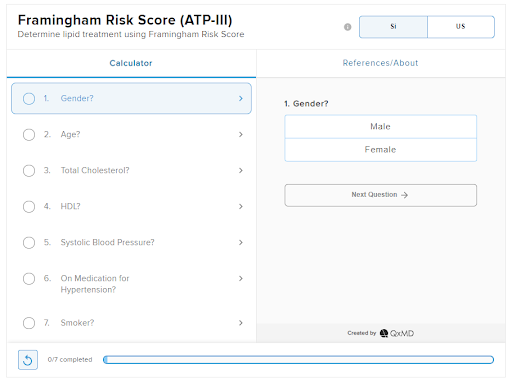
Framingham Risk Score (ATP-III). Created by QxMD.
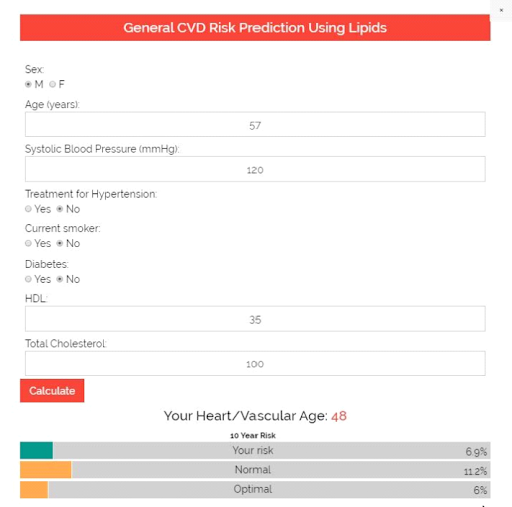
Here’s a Framingham Risk Calculator found on the website of Framingham Heart Study. It is based on the 2008 published article by D’Agostino and associates.
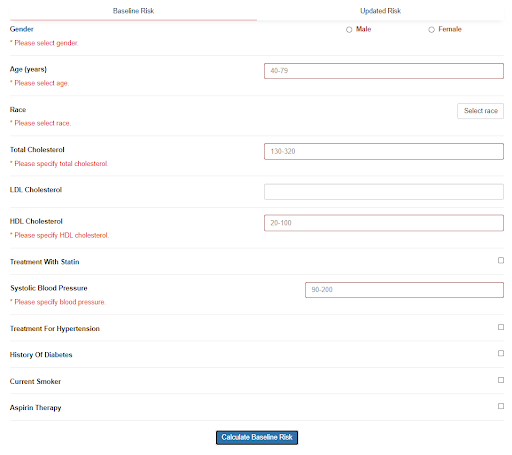
Currently, the Framingham Heart Study recommends the 2018 Prevention Guidelines Tool CV Risk Calculator. This is based on the algorithm published in 2013 ACC/AHA Guideline on the Assessment of Cardiovascular Risk (Goff, 2013).
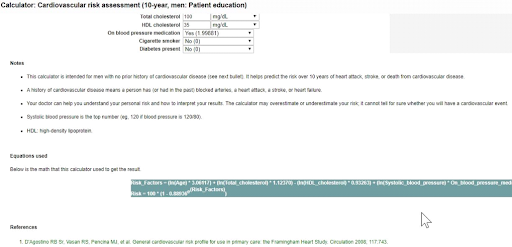
The Framingham Risk Score is just one of several scoring systems used to determine a person’s chances of developing a CV disease. You can quickly find other apps of this kind online, like in Calculators.org, The Calculator, MDCalc, and UpToDateⓇ (shown below):
What is the Framingham Heart Study?
In 1948, the US Congress commissioned the Framingham Heart Study, a large population study of heart disease.
The idea was to select and follow a cohort (a group that shares an experience) and look at different variables that possibly had an impact on heart disease development. At that time, heart disease and plaque development were considered normal parts of aging. Unfortunately, such notions are still common.
This brings us to Framingham in Massachusetts, a small town about 23 miles south of Boston. Probably due to its proximity to Harvard, this town was chosen for this study over the remaining competitor, Paintsville, Kentucky.
Since then, Framingham has become synonymous with the term “risk factor.” It also became the home of the most significant source of data for understanding the risk factors for heart disease.
During the first year, the Framingham Heart Study faced difficulties, which required a management team reorganization. The situation improved after Dr. Thomas Royle Dawber, then chair of the Department of Preventive Medicine at Boston University, was appointed the director and chief epidemiologist of the study.
Congress commissioned the Framingham Heart Study for 20 years. But at the end of the study, the scientific community wanted to close it. But Congress ignored the scientists’ advice and kept the study open.
That decision appears to be a good one—the Framingham cohort gave birth to more than 1,000 published studies. As of 2020, Congress has already funded 6 cohorts and 3 generations of patients. The first was the Original Cohort in 1948; the most recent is the Omni Two Cohort in 2003.

Framingham Heart Study. Screenshot from Framingham Heart Study’s Twitter page.
Moreover, the pieces of data from the Framingham Heart Study were studied and analyzed using the most sophisticated bio-statistics. This gave birth to the Framingham Risk Score, now renowned as the standard in CV risk factor estimation.
How Does the Framingham Risk Score Work?
The ACC/AHA prevention standards committee recommends that physicians use a CV risk calculator as a “first step” in CV risk evaluation. With a Framingham Risk Score, each patient can be compared to the Framingham cohorts who were followed for decades.
First, doctors would estimate CV risk by accounting for key risk factors, like age, gender, race, smoking history, cholesterol levels, diabetes status, and family history. Each of these risk factors has been shown to increase a person’s lifetime risk of CV disease independently.
Each risk factor would have an equivalent point. For example, a man with the following risk factors could net the following points:
- Age: 60 years old – 10 points.
- Total cholesterol: 200 mg/dL – 1 point.
- Cigarette smoker: Yes – 1 point.
- HDL cholesterol: 30 mg/dL – 2 points.
- Systolic blood pressure (untreated): 110 mmHg: 0 points.
The various points are added together for a total risk calculation. The total score then translates into a 10-year hazard risk ratio or the estimated risk of experiencing a CV event (like a heart attack or stroke) in the next 10 years.
In the case of the male patient in our example above, he nets a total of 14 points, which is equivalent to 16% CV risk over 10 years.
What is a Good Framingham Risk Score?
The Framingham Risk Score determines CV risk over 10 years expressed in percent. Here is a sample classification:
- 10% or less: low risk;
- 10-20%: intermediate risk;
- 20% or more: high risk.
Taking the case of the male patient above, his 16% CV risk means an intermediate risk.
Note, though, that these classifications are arbitrary.
Also, the Framingham Risk Score has undergone several revisions, and each version uses slightly different combinations of risk factors.
Is the Framingham Risk Score Accurate?
As the Framingham Risk Score provides an insight into a person’s risk of developing CV disease, it can also show who is most likely to benefit from prevention. For example, the Framingham Risk Score is used to determine who should be offered statins (like Judi in the introduction).
Unfortunately, the Framingham Risk Score is not infallible. Informed researchers are now calling the Framingham Risk Score a poor guess rather than a real calculator.
For one, the Framingham cohorts consisted of predominantly white, Anglo-Saxon men and women, a population that is no longer representative of the US population. One study even showed that among Japanese American and Hispanic men and native American women, the Framingham risk calculator systematically overestimates risk.
Moreover, the 2013 Framingham calculator often doubles the risk calculation, especially in women (Rospleszcz, 2019). In another study that involved adult United Arab Emirates nationals, the recommended risk threshold for statin eligibility is found to be too high (Al-Shamsi, 2020).
Another thing, family history is used as a risk factor as a proxy for genetic status, and this is another source of error. Family history often ignores the fact that people can get uncommonly expressed genes in their family. Sometimes, there are unknown “family members” contributing unrecognized genes to the pool.
According to critiques published in The New York Times, such miscalculation led to treatment recommendations (like statins) in far more people than necessary. The common practice of basing statin recommendations on cholesterol levels is partially blamed for this problem (Kolata, 2013).
These conclusions were not just the opinions of medical journalists. These conclusions were also demonstrated in studies by well-known researchers like Paul Ridker and Steven Nissen.
So why not revert to previous versions until the 2013 guidelines can be improved? That’s because the 2013 guidelines, though flawed, were far better than the ones they replaced.
How Does The Framingham Risk Calculator Lead to Over-Prescription of Statins?
Here’s how the Framingham Risk Score influences many people to go on statins.
During the consultation, the physician asks about the patient’s key risk factors (like age, cholesterol levels, etc.) and enters them into a CV risk calculator. Lifestyle and treatment recommendations would then be based on the calculator’s risk estimates (Castelli, 1984).
Why are the estimates so far off?
First, the calculator assumes a linear and equal relationship between each of the risk factors. According to Dr. H. Gilbert Welch, a medical professor at Dartmouth:
The model suggests that lowering systolic blood pressure from 130 to 100 is nearly as important as from 180 to 150… I doubt there is a cardiologist in the country that believes that. (Kolata, 2013)
Furthermore, Dr. Roger Blumenthal and Dr. Micheal Blaha of Johns Hopkins pointed out that the calculations could be improved by including “nontraditional” risk factors, such as CRP (C-reactive protein) or CAC (coronary artery calcium) scores (Kolata, 2013).
I can tell you that from my experience in supervising thousands of doctors in preventive practices, there are other problems.
For example, only a few doctors go through the entire risk calculation, while some doctors often shortcut the process. This shortcut is usually something simple, such as picking a simple LDL number (like 70 or 100) and recommending statins based on that.
However, even when the process is followed meticulously, the Framingham risk calculator would still cause problems.
How Can We Improve the Framingham Risk Calculator?
There have been proposals to improve the Framingham Risk Score, like combining the Framingham Risk Score with total plaque area for a more sensitive screening tool (Perez, 2016).
Other countries prefer to use other risk scoring methods, like the SCORE (Systematic COronary Risk Evaluation), which has been recommended by the European Society of Cardiology in 2007 (Conroy, 2003).
Perhaps the one proposal that’s getting traction is the inclusion of “nontraditional” risk factors. For instance, inflammation leads to heart attack and stroke, so it seems logical to include inflammation markers (like hsCRP or high sensitivity CRP) to get a true assessment of a person’s CV risk.
hsCRP is considered a “nontraditional” risk factor along with other tests like ABI (Ankle Brachial Index), leukocyte count, fasting blood glucose level, periodontal disease, carotid IMT, CAC score, homocysteine level, and lipoprotein(a).
But would the inclusion of nontraditional risk factors improve a person’s Framingham Risk Score?
That has been the point of a continuing debate. More than once, the US Preventive Services Task Force (USPSTF) assessed the addition of these “nontraditional” risk factors.
In its 2018 review, the Task Force found that the addition of these “nontraditional risk factors” improved the risk calculations significantly (USPSTF, 2018). Yet, the USPSTF did not recommend any changes to the Framingham risk calculator. Why?
According to the committee, there was no evidence that the improvements from using these new technologies would actually help physicians or patients make better choices.
The USPSTF concludes that the current evidence is insufficient to assess the balance of benefits and harms of using the ABI, hsCRP level, or CAC score in risk assessment for CVD in asymptomatic adults to prevent CVD events. (USPSTF, 2018)
I have a different opinion, and I am not alone. I agree with Drs. Blumenthal, Blaha, Ridker, and other experts who suggested the inclusion of nontraditional risk factors to enhance risk prediction capabilities and accuracy significantly.
Some things are certain.
One, the science continues to develop, the standards committees continue to meet, and the medical standards continue to improve, or at least change their recommendations.
Two, preventable heart attacks will, unfortunately, continue to occur while this change process takes shape.
Patients must therefore spend lots of time learning this information if they are to improve their chance of avoiding a CV event significantly. That’s a small price to pay for achieving what could be additional decades of healthy and disease-free living.
If you found this article helpful and want to start taking steps toward reversing your chronic disease, Dr. Brewer and the PrevMed staff are ready to serve you no matter where you’re located.
To find out more, schedule a consult here: prevmedhealth.com
References
Al-Shamsi S. Performance of the Framingham coronary heart disease risk score for predicting 10-year cardiac risk in adult United Arab Emirates nationals without diabetes: a retrospective cohort study. BMC Fam Pract. 2020 Aug 26;21, 175. doi:10.1186/s12875-020-01246-2.
American Heart Association (AHA). 2018 Prevention Guidelines Tool CV Risk Calculator. AHA website. http://static.heart.org/riskcalc/app/index.html#!/baseline-risk. Accessed December 18, 2020.
Brewer F. How Does Inflammation Cause Cardiovascular Disease? PrevMed website. https://prevmedhealth.com/cardiovascular-inflammation-and-plaque-formation. Accessed December 16, 2020.
Brewer F. How to Test for Cardiovascular Inflammation. PrevMed website. https://prevmedhealth.com/how-to-test-for-cardiovascular-inflammation. Accessed December 16, 2020.
Brewer F. More Important Than LDL? The Triglyceride/HDL Ratio. PrevMed website. https://prevmedhealth.com/more-important-than-ldl-the-triglyceride-hdl-ratio. Accessed December 16, 2020.
Brewer F. Prediabetes: A Risk for Heart Attack & Stroke? PrevMed website. https://prevmedhealth.com/prediabetes-a-risk-for-heart-attack-stroke. Accessed December 16, 2020.
Calculators.org. Fighting Heart Disease: Assess Risk & Save Lives. Calculators.org website. https://www.calculators.org/health/heart.php. Accessed December 11, 2020.
Castelli WP. Epidemiology of coronary heart disease: the Framingham study. Am J Med. 1984 Feb 27;76(2A):4-12. doi:10.1016/0002-9343(84)90952-5.
Conroy RM, Pyörälä K, Fitzgerald AP, Sans S, et al. Estimation of ten-year risk of fatal cardiovascular disease in Europe: the SCORE project. Eur Heart J. 2003 Jun;24(11):987-1003. doi: 10.1016/s0195-668x(03)00114-3.
D’Agostino RB Sr, Vasan RS, Pencina MJ, Wolf PA, et al. General cardiovascular risk profile for use in primary care: the Framingham Heart Study. Circulation. 2008 Feb 12;117(6):743-53. doi: 10.1161/CIRCULATIONAHA.107.699579. Epub 2008 Jan 22.
Framingham Heart Study. Cardiovascular Disease (10-year risk). Framingham Heart Study website. Framingham Heart Study website. https://framinghamheartstudy.org/fhs-risk-functions/cardiovascular-disease-10-year-risk. Accessed December 11, 2020.
Framingham.com. A Timeline of Milestones from The Framingham Heart Study. Framingham Heart Study website. https://framingham.com/heart/timeline.htm. Accessed December 11, 2020.
Goff DC Jr, Lloyd-Jones DM, Bennett G, Coady S, et al. 2013 ACC/AHA guideline on the assessment of cardiovascular risk: a report of the American College of Cardiology/American Heart Association Task Force on Practice Guidelines. Circulation. 2014 Jun 24;129(25 Suppl 2):S49-73. doi: 10.1161/01.cir.0000437741.48606.98.
Kolata G. Flawed Gauge for Cholesterol Risk Poses a New Challenge for Cardiologists. The New York Times website. https://www.nytimes.com/2013/11/19/health/flawed-gauge-for-cholesterol-risk-poses-a-new-challenge-for-cardiologists.html. November 18, 2013. Accessed December 11, 2020.
Medscape. Framingham Risk Score (ATP-III): Determine lipid treatment using Framingham Risk Score. Medscape website. https://reference.medscape.com/calculator/253/framingham-risk-score-atp-iii. Accessed December 18, 2020.
National Cholesterol Education Program (NCEP) Expert Panel on Detection, Evaluation, and Treatment of High Blood Cholesterol in Adults (Adult Treatment Panel III). Third Report of the National Cholesterol Education Program (NCEP) Expert Panel on Detection, Evaluation, and Treatment of High Blood Cholesterol in Adults (Adult Treatment Panel III) final report. Circulation. 2002 Dec 17;106(25):3143-421.
National Institutes of Health (NIH). The Framingham Heart Study: Laying the Foundation for Preventative Healthcare. https://www.nih.gov/sites/default/files/about-nih/impact/framingham-heart-study.pdf. Accessed December 11, 2020.
Perez HA, Garcia NH, Spence JD, Armando LJ. Adding carotid total plaque area to the Framingham risk score improves cardiovascular risk classification. Arch Med Sci. 2016;12(3):513-520. doi:10.5114/aoms.2016.59924
Rospleszcz S, Thorand B, de Las Heras Gala T, Meisinger C, Holle R, Koenig W, Mansmann U, Peters A. Temporal trends in cardiovascular risk factors and performance of the Framingham Risk Score and the Pooled Cohort Equations. J Epidemiol Community Health. 2019 Jan;73(1):19-25. doi:10.1136/jech-2018-211102.
The Calculator. Framingham Risk Score Calculator for Coronary Heart Disease. The Calculator website. https://www.thecalculator.co/health/Framingham-Risk-Score-Calculator-for-Coronary-Heart-Disease-745.html. Accessed December 11, 2020.
UpToDateⓇ. Calculator: Cardiovascular risk assessment (10-year, men: Patient education). UpToDateⓇ website. https://www.uptodate.com/contents/calculator-cardiovascular-risk-assessment-10-year-men-patient-education. Accessed December 11, 2020.
U.S. Preventive Services Task Force (USPSTF). Cardiovascular Disease: Risk Assessment With Nontraditional Risk Factors. USPSTF website. https://www.uspreventiveservicestaskforce.org/uspstf/document/RecommendationStatementFinal/cardiovascular-disease-screening-using-nontraditional-risk-assessment. July 10, 201. Accessed December 11, 2020.
Wikipedia. Framingham Risk Score. Wikipedia website. https://en.wikipedia.org/wiki/Framingham_Risk_Score. Accessed December 16, 2020.
Wilson PWF. Framingham Risk Score for Hard Coronary Heart Disease. MDCalc website. https://www.mdcalc.com/framingham-risk-score-hard-coronary-heart-disease. Accessed December 11, 2020.
Yang EH. What is the Framingham Risk Score (FRS)? Medscape website. https://www.medscape.com/answers/2500032-166149/what-is-the-framingham-risk-score-frs. Accessed December 16, 2020.